 (0.8Mb) Danielle Albers Szafir. "Modeling Color Difference for Visualization Design." IEEE Transactions on Visualization and Computer Graphics, 2018. In the Proceedings of the 2017 IEEE VIS Conference.
Talk Slides
Abstract: Color is frequently used to encode values in visualizations. For color encodings to be effective, the mapping between colors and values must preserve important differences in the data. However, most guidelines for effective color choice in visualization are based on either color perceptions measured using large, uniform fields in optimal viewing environments or on qualitative intuitions. These limitations may cause data misinterpretation in visualizations, which frequently use small, elongated marks. Our goal is to develop quantitative metrics to help people use color more effectively in visualizations. We present a series of crowdsourced studies measuring color difference perceptions for three common mark types: points, bars, and lines. Our results indicate that peoples’ abilities to perceive color differences varies significantly across mark types. Probabilistic models constructed from the resulting data can provide objective guidance for designers, allowing them to anticipate viewer perceptions in order to inform effective encoding design.
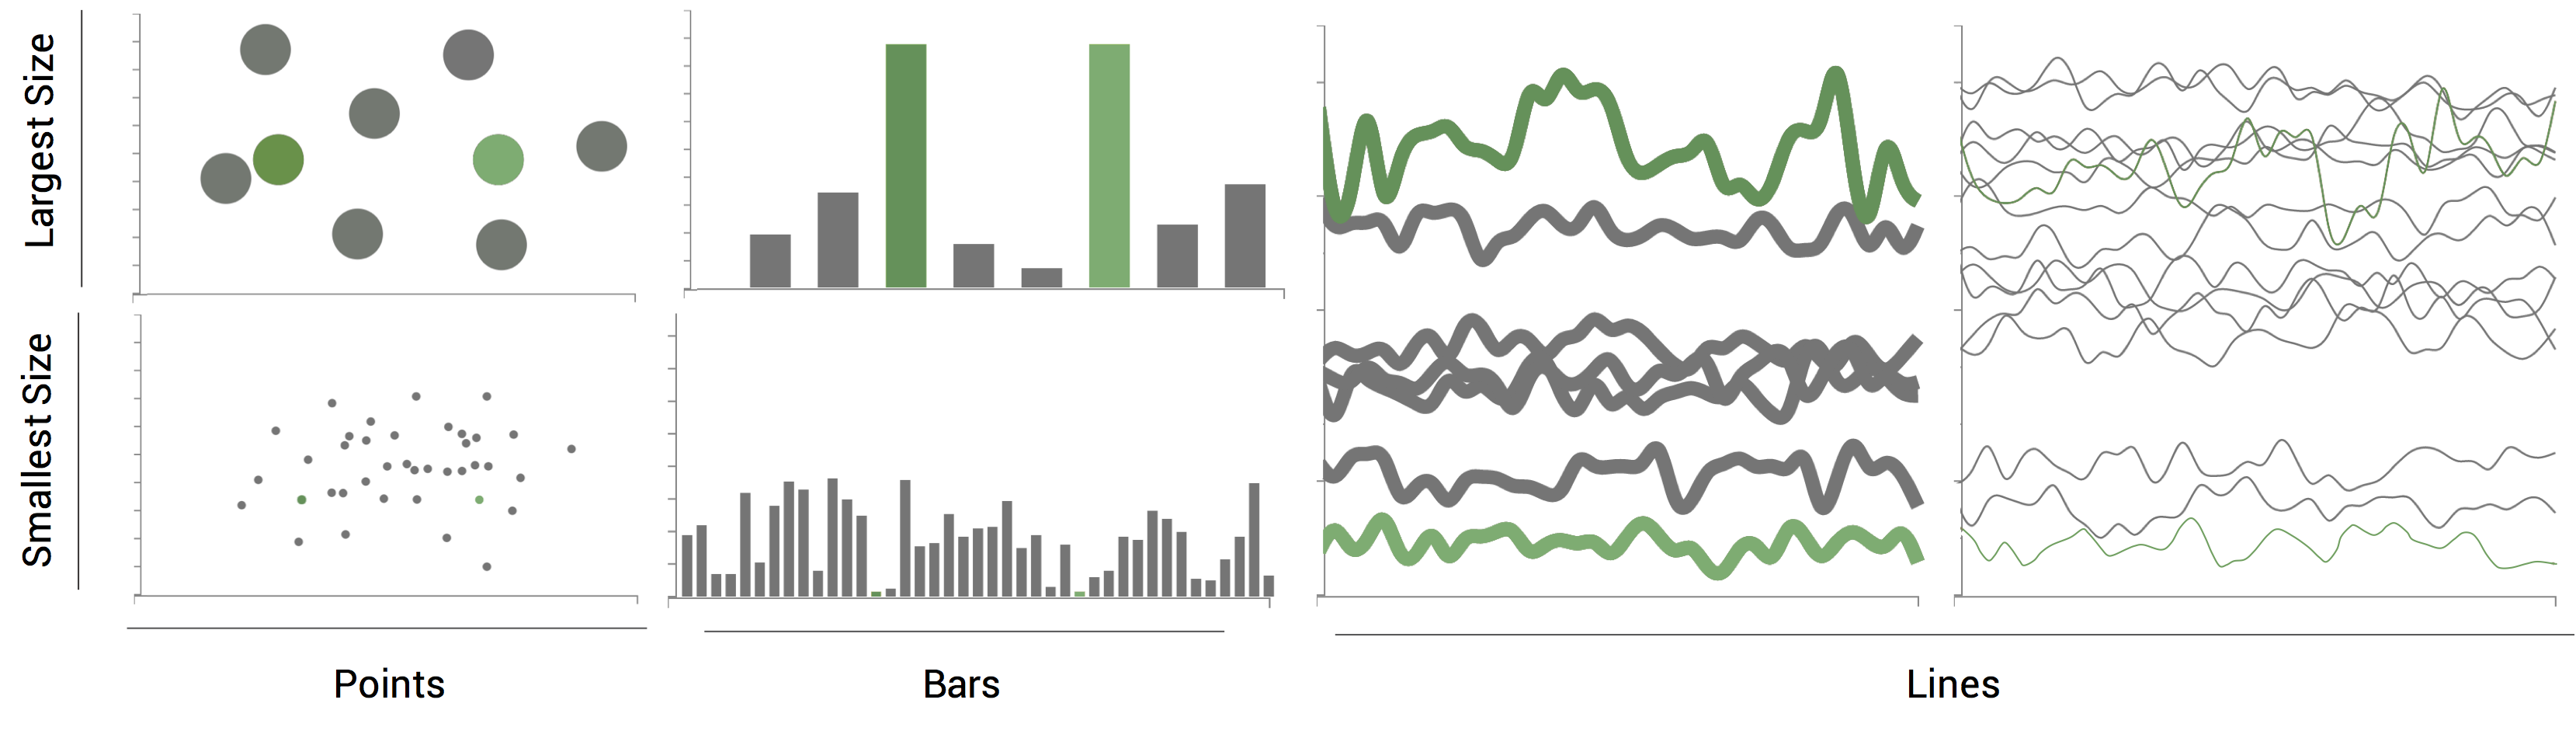
Below are the supplemental materials for "Modeling Color Difference for Visualization Design." The data captures our intermediate models of color difference perceptions for data visualizations modeled over three different mark types: diagonally symmetric marks (e.g., points in a scatterplot), elongated marks (e.g., bars in a bar chart), and asymmetric elongated marks (e.g., lines in a line graph). The data and infrastructures can be used to replicate and extend the models presented in the paper.
Points Data:
- Table of Discriminability Rates for Scatterplot Points, measuring the proportion of reported differences for each combination of point size, tested color difference, and axis.
- Table of Linear Slopes per Size for Scatterplot Points, containing the fit-to-zero linear models and inferential statistics computed from the discriminability rates at each size.
- A Table of Tested Colors sampled uniformly from CIELAB.
Bars Data:
- Discriminability Rates for Bar Charts, measuring the proportion of reported differences for each combination of bar thickness, length, tested color difference, and axis.
- Linear Slopes per Size for Bar Charts, containing the fit-to-zero linear models and inferential statistics computed from the discriminability rates at each size.
Lines Data:
- Discriminability Rates for Line Graphs, measuring the proportion of reported differences for each combination of line thickness, tested color difference, and axis.
- Linear Slopes per Size for Line Graphs, containing the fit-to-zero linear models and inferential statistics computed from the discriminability rates at each size.
ColorBrewer Analysis:
- Discriminability Analysis for ColorBrewer computing the normalized Delta E(50%,s) steps between 18 9-step sequential encodings.